Home Blog Page 366

IEA releases Oil Market Report for August

Crude oil prices eased to around $45 per barrel in August as a global supply overhang weighed and demand growth weakened, the newly released IEA Oil Market Report (OMR) for August informs subscribers. Brent crude had threatened to break below $40 per barrel at the end of July.

Global oil demand growth is expected to slow from 1.4 mb/d in 2016 to 1.2 mb/d in 2017, as underlying support from low oil prices wanes. The 2017 forecast – though still above-trend – is 0.1 mb/d below our previous expectations due to a dimmer macroeconomic outlook. The 2016 outlook is unchanged from last month’s Report.

Meanwhile global oil supply rose by about 0.8 mb/d in July, as both OPEC and non-OPEC production increased. Output was 215 kb/d lower than a year earlier, as declines from non-OPEC more than offset an 840 kb/d annual gain in total OPEC liquids. Non-OPEC production is forecast to drop by 0.9 mb/d this year before rebounding by 0.3 mb/d in 2017.

OPEC crude oil output rose by 150 kb/d to 33.39 mb/d in July as Saudi Arabia pushed output to the highest ever and Iraq pumped more. Robust Middle East production lifted total OPEC crude supply 680 kb/d above a year ago and held output at an eight-year high.

Global refinery throughput in the third quarter is expected to rise by 2.2 mb/d from a weak second quarter to a record 80.6 mb/d. At only 0.6 mb/d above a year earlier, third quarter runs will lag expected demand growth, eroding some of the product stock cushion built up since mid-2015. Runs are forecast to decline seasonally to below 80 mb/d in the fourth quarter of 2016.

An OECD inventory overhang continued to shift from crude into products during June, with commercial stocks swelling by 5.7 mb to a record 3 093 mb. Declines in crude oil holdings were offset by an above average product build of 15.9 mb, with big volumes of US propane and other NGLs moving into storage.

Source: iea.org

Kenya to Install 23 Solar Mini-Grids to Power Remote North

Foto: Pixabay
Photo-illustration: Pixabay

The Kenya government, with the support of a 33-million-euro credit from the French government, plans to install 23 solar mini-grid power stations with the capacity to produce 9.6 MW of power to connect households in remote northern Kenya to electricity.

Also to be installed as part of the project is a 0.6-MW mini-grid wind power plant, scaling up projected wind power production in the country in the next four years.

Already Lake Turkana Wind Power project, a 320-MW wind project in Africa owned by KP&P Africa B.V, Aldwych International as co-developers, Industrial Fund for Developing Countries (IFU) and Google Plc, is under construction with a projected completion date of 2018.

The latest initiative will see power stations put up across seven arid counties in northern Kenya neighbouring Somalia and Ethiopia that have been relying on thermal power in select major trading centers, leaving hundreds of thousands of pastoral communities without power.

Kenya president Uhuru Kenyatta and French Foreign Minister Jean-Marc Ayrault witnessed the signing of the credit facility agreement on Aug. 1.

“This project will reduce the average cost of electricity production via mini-grids by an average of 20 percent, contribute to the improvement of energy security of supply of Kenya, support economic development by promoting more reliable electricity service [and reduce] greenhouse gas emissions associated with the combustion of diesel,” Kenyatta said.

The new financing is aligned with the key pillars of France’s cooperation policy in the energy sector aimed at promoting access to electricity for all to support sustainable economic development, and in particular supporting  development of renewable energy to contribute to the fight against climate change, the French foreign minister said.

Kenya’s 50 percent government-owned power distribution company will implement the project, which will be mainly anchored on the 23 solar PV power stations to help over 1 million in the remote region access power.

The French Development Agency, an institution that has so far committed over 800 million euros in loans to Kenya’s power sector since 2000, will handle disbursement of the funds on behalf of the French government.

Since 2013, Kenya has doubled the number of citizens connected to the grid from around 13 million to some 25 million, with more than 22,000 schools connected to electricity in the entire country in a project that will cost the government US $350 million. About 4,000 of those schools are connect through stand-alone solar PV.

Power generation has also risen from 1,765 MW to more than 2,422 MWs, more than a half of it coming from renewable sources.

Source: renewableenergyworld.com

First Solar offloads 11 MW

indexAn affiliate of D.E. Shaw Renewable Investments has acquired the 11-megawatt Rancho Seco solar project in Sacramento County from First Solar. The terms of the deal were not disclosed. The Golden 1 Center, currently under construction for the Sacramento Kings basketball team, will obtain approximately 85 percent of its power from the project.

First Solar is a leading global provider of comprehensive photovoltaic (PV) solar energy solutions that are truly Taking Energy Forward. With over 10 gigawatts (GW) installed worldwide, our proven solar solutions diversify the energy portfolio and reduce the risk of fuel-price volatility while delivering a levelized cost of electricity (LCOE) that is cost competitive with fossil fuels today. By integrating technologies and expertise across the entire solar value chain, First Solar delivers bankable PV energy solutions that maximize the value of our customers’ PV investment while minimizing their risk. Having developed, financed, engineered, constructed, and operating some of the world’s largest and most successful PV power plants in existence, First Solar has become the partner of choice for customers globally.

Source: breakingenergy.com and firstsolar.com

Sonoma Clean Power Signs New Wind Contract

indexSonoma Clean Power (SCP), the nonprofit public agency in USA that has been generating electricity for 88 percent of Sonoma County’s residents and business owners since launching in 2014, has signed a power purchase agreement (PPA) for 20 years of wind power from Golden Hills North Wind Energy Center. The project, located in Eastern Alameda County within the Altamont Pass Wind Resource Area, is being developed by Next Era Energy Resources and, according to SCP, represents the agency’s first long-term, in-state wind contract.

Source: breakingenergy.com

Gazprom’s financial information under International Financial Reporting Standards (IFRS) for the three months ended March 31, 2016

Today PJSC Gazprom issued its unaudited consolidated interim condensed financial information prepared in accordance with International Accounting Standard 34 Interim Financial Reporting (IAS 34) for the three months ended March 31, 2016.

Total sales (net of excise tax, VAT and customs duties) increased by RUB 89,111 million, or 5%, to RUB 1,737,364 million for the three months ended March 31, 2016 compared to the same period of the prior year. The increase in sales is mainly driven by the increase in sales of gas to Europe and Other countries.

Net sales of gas increased by RUB 71,245 million, or 7%, to RUB 1,072,854 million for the three months ended March 31, 2016 compared to the same period of the prior year.

Net sales of gas to Europe and Other countries increased by RUB 120,183 million, or 22%, to RUB 663,176 million for the three months ended March 31, 2016 compared to the same period of the prior year. This was mainly driven by the increase in volumes of gas sold by 49%, or 19.0 bcm, which was partially compensated by the decrease in average Russian Ruble prices (including excise tax and customs duties) by 22%.

Net sales of gas to Former Soviet Union countries decreased by RUB 38,703 million, or 25%, to RUB 116,935 million for the three months ended March 31, 2016 compared to the same period of the prior year. The change was due to the decrease in volumes of gas sold by 16%, or 2.0 bcm, and the decrease in average Russian Ruble prices (including customs duties) by 13%.

Net sales of gas in the Russian Federation increased by RUB 5,297 million, or 2%, to RUB 291,850 million for the three months ended March 31, 2016 compared to the same period of the prior year. This is primarily explained by the increase in average prices by 9%, that was partially compensated by the decrease in volumes of gas sold by 6%, or 4.9 bcm.

Operating expenses increased by RUB 282,314 million, or 24%, to RUB 1,453,899 million for the three months ended March 31, 2016 compared to the same period of the prior year.

The increase in operating expenses is explained by an increase in a number of items such as:

 “Purchased gas and oil” – an increase by RUB 138,804 million due to an increase in expenses for gas as a result of the change in the scope of consolidation related to the completion of the Swap Agreement between PJSC Gazprom and Wintershall Holding GmbH on 30 September 2015;

 “Transit of gas, oil and refined products” – an increase by RUB 41,306 million, or 33%.

Moreover, the change in foreign currency exchange rates in the reporting period resulted in an increase in expense disclosed in the line item “Foreign exchange rate differences on operating items” by RUB 25,211 million, or 145%.

Profit attributable to the owners of PJSC Gazprom for the three months ended March 31, 2016 totaled RUB 362,309 million which is RUB 19,803 million, or 5% less than for the same period of the prior year.

Net debt balance (defined as the sum of short-term borrowings, current portion of long-term borrowings, short-term promissory notes payable, long-term borrowings, long-term promissory notes payable, net of cash and cash equivalents and balances of cash and cash equivalents restricted as to withdrawal under the terms of certain borrowings and other contractual obligations) decreased by RUB 300,102 million, or 14%, from RUB 2,083,120 million as of December 31, 2015 to RUB 1,783,018 million as of March 31, 2016. This decrease resulted from an increase in cash and cash equivalents and change in foreign currency exchange rates (depreciation of US Dollar and Euro).

Source: Gazprom.com

World’s Largest Development Banks Raise $81Bln to Tackle Climate Change

Photo: Pixabay
Photo: Pixabay

Six of the world’s largest multilateral development banks (MDBs) rounded up $81 billion last year to finance climate change action, their joint report released Tuesday showed.

“In 2015, the MDBs collectively committed more than USD 25 billion in climate finance,” the report worked out by the Asian Development Bank (ADB) together with African, European, Inter-American banks and the World Bank Group revealed.

Further $56 billion were contributed to MDBs’ projects by other investors, the Manila-based lender said. The banks have cumulatively financed over $131 billion in climate action since 2011.

The largest share of total funding went to non-EU countries in Europe and Central Asia, followed by South Asia and Latin America. Over $20 billion in MDBs financing was spent on the mitigation of adverse climate change impact.

The lenders pledged to increase their contribution to efforts of reducing greenhouse emissions and promoting clean energy ahead of the historic UN Climate Change Conference in Paris in November — December 2015.

Source: sputniknews

Russia Open for Talks on Gas Price Discount for Turkey – Energy Minister

Foto: Pixabay
Photo: Pixabay

Russia is willing to discuss a lower price for natural gas deliveries to Turkey, the Russian energy minister said Tuesday after President Vladimir Putin met with his Turkish counterpart in St. Petersburg.

At the end of 2015, Russian gas accounted for about 50 percent of Turkey’s total gas imports. In March, Turkish gas importer Enerco Enerji said that Russia’s energy giant Gazprom had canceled a 10.25-percent price discount. Gazprom said the dispute was settled in April.

“If the Turkish side raises this question, we will discuss and analyze the situation, monitor it and hold negotiations,” Alexander Novak told Russia’s Rossiya 24 TV channel.

Source: sputniknews.com

SolarCity And ComEd Discover Shared Vision For Utilities’ Future

Photo: Pixabay
Photo: Pixabay

ComEd doesn’t deliver any solar energy to its Chicago-area customers, and California-based SolarCity doesn’t do business in Illinois, but from distant reaches of the country, and from opposite ends of the power grid, the two companies have come to much the same conclusion about the future of utilities.

Their respective CEOs, Anne Pramaggiore for ComEd and Lyndon Rive for SolarCity, urged legislators from all 50 states Monday to write laws that would help utilities shift from energy-delivery pipelines to energy-sharing platforms.

“We’re initiating our delivery system’s shift from today’s pipeline architecture—moving central-station power across wires to customers at the other end—to a platform architecture, which is the business architecture of the 21st Century,” Pramaggiore said at the National Conference of State Legislatures’ Legislative Summit in Chicago.

A platform architecture would allow utilities to use their infrastructure, which connects to almost everyone, to create a market that customers could access to buy and sell energy and energy services (like storage). In such a model, which she called “the ultimate Uber,” utilities would be compensated with fees on transactions and charges for services they provide.

“Right now the way we’re compensated—the way we manage our business and price our product—is based on volume pricing of kilowatt-hour sales. And that really has to change because it’s clear that our customers want to use less kilowatt hours, and not all the kilowatt hours will be moving through our system in the same way that they have in the past.”

It’s unusual, Rive said, for utilities to accept change so readily.

“Oftentimes when you add a disruptive technology to an old legacy infrastructure, the incumbents will do everything they can to slow the adoption,” said Rive, who heads the nation’s largest installer of residential solar systems. “Now, Anne Pramaggiore seems to realize that they need to change. It’s rare to see a utility executive speak as she has, embracing the new infrastructure.”

Rive urged legislators to create a revenue model that gives utilities an incentive to embrace distributed generation. Right now, some regulations forbid utilities from earning anything when they buy and resell energy generated by consumers, he said. In other words, if a utility pays a customer $10 for homegrown energy, the utility must sell that energy to another customer for $10.

“We’re a big advocate to allow utilities to start making money off of someone else’s infrastructure,” he said.

Then utilities would be more willing to serve as a platform for consumers who want to generate and store energy and share it with their neighbors, Rive said. Rive also issued a warning to legislators. Distributed generation is coming, he said, because people want it and it’s the right thing to do. If regulators don’t change the current infrastructure to accommodate it, a new infrastructure will develop parallel to the old one.

“If that continues, you’re going to end up with stranded assets.”

And the outcome, according to both CEOs, is up to the states.

“State policy has never been more important,” Pramaggiore said. Renewables policy is set at the state level. Energy prices, important to the competitive success of different energy sources, are set at the state level. Carbon pricing, seemingly gridlocked at the federal level, seems to be shifting to the state level. And the business model of the future utility will be determined by the states.

“States have within their purview the ability to respond to the major issues of our industry over the next 20 to 30 years,” Pramaggiore told legislators. “So you really have the ability to shape this.”

Source: forbes.com

IEA data shows global energy production and consumption continue to rise

Figure1AlternateReflecting the IEA’s increasingly global perspective, for the first time the Agency’s OECD and non-OECD Energy Balances and Statistics reports have been merged into two comprehensive global reports on energy data. World energy Balances and World Energy Statistics will contain detailed data on over 150 countries and regions and will be released in full at the end of August 2016.
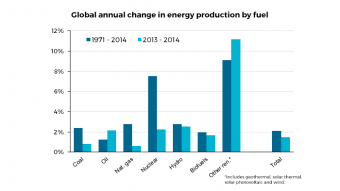
These reports show that world energy production reached 13 800 million tonnes of oil equivalent (Mtoe) in 2014, up 1.5% from 2013. Fossil fuels accounted for 81% of this production – 0.4% lower than in 2013 – in spite of rising oil (+2.1%), coal (+0.8%) and natural gas production (+0.6%), as production of renewables grew even faster. For example Hydro production was up 2.5% and accounted for 2.4% of global production while wind and solar PV continued their fast growth (+11% and +35% respectively), and accounted for around 1% of global energy production. Among non-fossil sources, biofuels and waste accounted for 10.2% of world energy production in 2014 and nuclear slightly increased its share to 4.7%.

While restricted to primary fossil fuels, preliminary 2015 global country level production data show a clear slowdown in the growth of fossil fuel production, only 0.5% higher than in 2014. While crude oil and natural gas production increased at a higher rate than in 2014 (+3.0% and +1.6% respectively), a 3.1% fall in coal production over the same period resulted in an overall slowdown in growth.

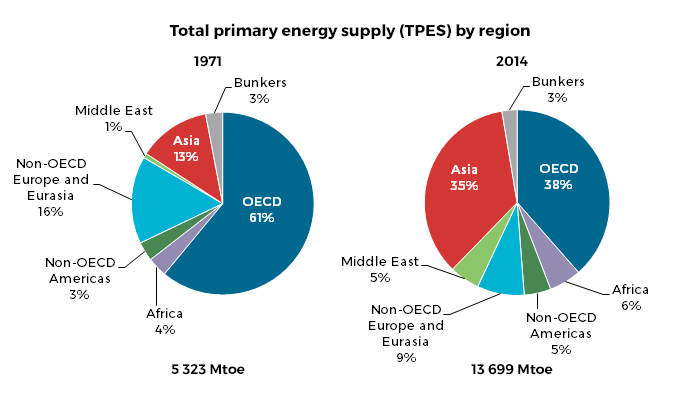
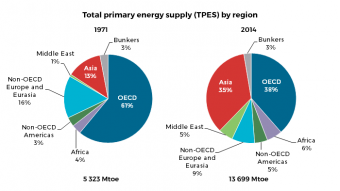
Figure2alternateThe reports also highlight the significant changes in regional energy demand that have taken place over the past 40 years. In 1971 OECD (including Japan and Korea) and the rest of Asia (including China) together accounted for almost three quarters of energy usage, with OECD demand four times greater than that of Asia. Yet while the combined energy share of these regions remained at around three quarters of the global total in 2014, the proportions changed drastically; OECD and Asia became broadly comparable, at 38% and 35% respectively.
This drop in the OECD’s share of global total primary energy supply – or TPES, a measure of total energy use both in transformation and final use – from 61% in 1971 to 38% in 2014 reflects the fact that since 1971, annual average growth in TPES in Asia was above 5% for all fuels except biomass – significantly above the average global increase.

This increase in demand for energy in Asia has been driven by consumers, with final consumption in the region increasing five-fold over four decades. Coal remains the most consumed fuel, with approximately the same share in 1971 and 2014 (29% and 28% respectively). However the rest of the mix is seeing rapid change. The share of oil in total final consumption almost doubled (from 15% to 28%), while electricity rose from 3% to 19%. Following a seven-fold increase, industry was by far the greatest energy consuming sector in Asia in 2014, representing 42% of the region’s total final consumption, largely fueled by coal. The residential sector followed industry in energy use, having seen a 120% increase between 1971 and 2014. Traditional biomass was still the main fuel consumed by households, while electricity and natural gas consumption also increased significantly. Energy consumption grew 12-fold in the transport sector, and continued to rely mainly on oil.

Globally, total consumption more than doubled between 1971 and 2014. However the sectoral breakdown of energy use did not change dramatically. Industry remained the largest consuming sector in 2014, only one percentage point lower than in 1971 (37%), followed by transport (28%), a 5% increase on 1971 figures, and residential (23%).

Looking solely at OECD countries, where provisional data are available for 2015, energy production hit 4 164 Mtoe in 2015, a 0.5% increase on 2014 figures, and the highest level since the IEA was founded in 1974. Exports were also the highest ever recorded at 1 790 Mtoe (+5.5% from 2014). Following three consecutive years of decline, imports increased by 3.2%, with net imports remaining broadly stable in the region compared to 2014. OECD total primary energy supply remained stable in 2015, coming in at 5 269 Mtoe, only 0.1% less than in 2014.

In terms of the fuel mix, the OECD increased its use of oil (36% of TPES, +1%) and natural gas (26% of TPES, +2%) in 2015. Nuclear (10% of TPES) remained stable, with Asia-Oceania increasing its use while Europe decreased. Other sources (10% of TPES) increased by 2%, mainly due to renewables. Significantly, there was a drop of 15% in the United States of coal use over 2014 figures. In 2015, more than 200 TWh of electricity came from natural gas, driving a 6% decrease in the OECD region’s overall coal demand.

With production increasing more than energy use, the level of self-sufficiency (defined as production/TPES) in the OECD increased to 79% in 2015, a figure comparable to the high levels of 1985. Notably, in 2015, OECD Americas became self-sufficient for the first time since the IEA was founded, with the United States not far behind at 93%. This is in contrast with the levels observed in OECD Europe and OECD Asia Oceania, both coming in at below 60%.

Source: iea.org

Wind farms do not discourage tourists, economists find

Photo: Pixabay
Photo: Pixabay

Wind farms do not discourage holidaymakers, according to new research which “puts to bed the myth” that the sight of turbines on the horizon damages tourism.

A report by economic consultants said the onshore wind industry in Scotland had expanded dramatically in recent years, from 2 gigawatts of capacity in 2009 to 4.9GW in 2014. Over a similar period, the number of jobs in “sustainable” tourism had grown by more than 10 per cent.

But, while this suggested that both sectors could “co-exist and grow”, they decided to look more closely at the local effects of the construction of a new wind farm on 18 different places across Scotland.

And they found that in 15 of the 18 locations, sustainable tourism employment had increased by more than the Scottish average despite the appearance of turbines.

They also pointed to a survey of 380 tourists in Caithness and Sutherland, Stirling, Perth and Kinross, the Scottish Borders and Dumfries and Galloway by Glasgow Caledonian University.

Of those, 75 per cent felt wind farms had a positive or neutral effect on the landscape. Just four people, two per cent of those who had seen turbines, said it would affect their decision to visit the area again: two said they would be less likely to return, while the other two were more keen to come back.

The report’s author, Graeme Blackett, director of Biggar Economics, said: “Both renewable energy and tourism have been identified by the Scottish Government as key growth sectors, and therefore it is important to identify if there are any detrimental effects to one from the development of the other.

“What this study shows is that there is no relationship between the growth in the onshore wind sector and growth in the tourism sector.

“While this is just one piece of research, it is the first that has looked systematically at the situation before and after wind farms have been developed, and it clearly demonstrates that renewable energy and tourism can co-exist in a modern Scotland.”

According to figures from the Office for National Statistics, there were 211,215 jobs in sustainable tourism in Scotland in 2013. Government figures showed renewable energy supported 21,000 jobs in Scotland, 5,400 of which were in onshore wind, in the same year.

Lang Banks, director of environmental campaign group WWF Scotland, said: “Hopefully this latest research will finally put to bed the myth that wind farms have a negative impact on tourism jobs.

“In fact, the reality is that in some cases wind farms have themselves become tourist attractions.

“Over the past decade, Scotland’s growth in renewables has created thousands of new jobs. And, to ensure we continue to reap the many benefits of a low carbon economy the Scottish Government’s forthcoming energy strategy should set a goal of securing half of all of our energy, across electricity, heat and transport, from renewables by 2030.”

Lindsay Roberts, senior policy manager at Scottish Renewables, said: “This research joins the growing body of evidence that clearly shows there is no negative impact on the tourism industry from the development of onshore wind.

“In fact, the study found that employment in tourism in the majority of areas immediately surrounding wind farms grew faster than in the wider local authority areas where they were situated.

“Last year Scottish Renewables found that more than 13,000 miles had been covered by runners and cyclists alone on infrastructure tracks installed for wind farms and hydropower schemes.

“Today’s new figures demonstrate once again that the well-documented economic and environmental benefits of green energy go hand in hand with significant social benefits.”

Source: independent.co.uk

Scientists convert carbon dioxide, create electricity

160804171642_1_540x360While the human race will always leave its carbon footprint on the Earth, it must continue to find ways to lessen the impact of its fossil fuel consumption.

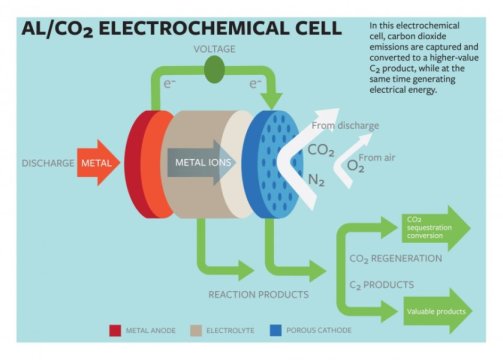
“Carbon capture” technologies — chemically trapping carbon dioxide before it is released into the atmosphere — is one approach. In a recent study, Cornell University researchers disclose a novel method for capturing the greenhouse gas and converting it to a useful product – while producing electrical energy.

Lynden Archer, the James A. Friend Family Distinguished Professor of Engineering, and doctoral student Wajdi Al Sadat have developed an oxygen-assisted aluminum/carbon dioxide power cell that uses electrochemical reactions to both sequester the carbon dioxide and produce electricity.

Their paper, “The O2-assisted Al/CO2 electrochemical cell: A system for CO2 capture/conversion and electric power generation,” was published July 20 in Science Advances.

The group’s proposed cell would use aluminum as the anode and mixed streams of carbon dioxide and oxygen as the active ingredients of the cathode. The electrochemical reactions between the anode and the cathode would sequester the carbon dioxide into carbon-rich compounds while also producing electricity and a valuable oxalate as a byproduct.

In most current carbon-capture models, the carbon is captured in fluids or solids, which are then heated or depressurized to release the carbon dioxide. The concentrated gas must then be compressed and transported to industries able to reuse it, or sequestered underground. The findings in the study represent a possible paradigm shift, Archer said.

“The fact that we’ve designed a carbon capture technology that also generates electricity is, in and of itself, important,” he said. “One of the roadblocks to adopting current carbon dioxide capture technology in electric power plants is that the regeneration of the fluids used for capturing carbon dioxide utilize as much as 25 percent of the energy output of the plant. This seriously limits commercial viability of such technology. Additionally, the captured carbon dioxide must be transported to sites where it can be sequestered or reused, which requires new infrastructure.”

The group reported that their electrochemical cell generated 13 ampere hours per gram of porous carbon (as the cathode) at a discharge potential of around 1.4 volts. The energy produced by the cell is comparable to that produced by the highest energy-density battery systems.

Another key aspect of their findings, Archer says, is in the generation of superoxide intermediates, which are formed when the dioxide is reduced at the cathode. The superoxide reacts with the normally inert carbon dioxide, forming a carbon-carbon oxalate that is widely used in many industries, including pharmaceutical, fiber and metal smelting.

“A process able to convert carbon dioxide into a more reactive molecule such as an oxalate that contains two carbons opens up a cascade of reaction processes that can be used to synthesize a variety of roducts,” Archer said, noting that the configuration of the electrochemical cell will be dependent on the product one chooses to make from the oxalate.

Al Sadat, who worked on onboard carbon capture vehicles at Saudi Aramco, said this technology in not limited to power-plant applications. “It fits really well with onboard capture in vehicles,” he said, “especially if you think of an internal combustion engine and an auxiliary system that relies on electrical power.”

He said aluminum is the perfect anode for this cell, as it is plentiful, safer than other high-energy density metals and lower in cost than other potential materials (lithium, sodium) while having comparable energy density to lithium. He added that many aluminum plants are already incorporating some sort of power-generation facility into their operations, so this technology could assist in both power generation and reducing carbon emissions.

A current drawback of this technology is that the electrolyte – the liquid connecting the anode to the cathode – is extremely sensitive to water. Ongoing work is addressing the performance of electrochemical systems and the use of electrolytes that are less water-sensitive.

Source: sciencedaily.com

“Green Finance” Incorporated into G20 Finance Ministers and Central Bank Governors Meeting Communiqué

G20 Finance Ministers and Central Bank Governors held their third meeting on July 23-24 in Chengdu, and issued the final Communiqué before this year’s G20 Summit in Hangzhou, emphasizing the development of green finance and welcoming voluntary options developed by the G20 Green Finance Study Group (GFSG).

This year green finance was incorporated for first time into the G20 agenda. At the initiative of the Chinese G20 presidency, the G20 established the GFSG, co-chaired by China and the United Kingdom with support from the United Nations Environment Programme (UNEP) as secretariat.

More than 80 participants from all G20 members, as well as a number of invited countries and six international organizations, actively participated in the GFSG. Over the past six months, the GFSG hosted four core meetings, developed the G20 Green Finance Synthesis Report and submitted it to the Third Finance Ministers and Central Bank Governors Meeting held yesterday in Chengdu. The Synthesis Report comprehensively examines the necessity and challenges of developing green finance globally. It also provides seven voluntary options to overcome these challenges facing green finance development.

The G20 Finance Ministers and Central Bank Governors Meeting Communiqué states:

“We recognize that, in order to support environmentally sustainable growth globally, it is necessary to scale-up green financing. We welcome the G20 Green Finance Synthesis Report submitted by the Green Finance Study Group (GFSG), and welcome the voluntary options developed by the GFSG to enhance the ability of the financial system to mobilize private capital for green investment. In particular, we believe that efforts could be made to provide clear strategic policy signals and frameworks, promote voluntary principles for green finance, expand learning networks for capacity building, support the development of local green bond markets, promote international collaboration to facilitate cross-border investment in green bonds, encourage and facilitate knowledge sharing on environmental and financial risks, and improve the measurement of green finance activities and their impacts.”

Commenting on the report, Ma Jun, Chief Economist of the People’s Bank of China, said: “Promoting the consensus of developing green finance internationally is a key objective of the G20 GFSG. The statements in the G20 Finance Ministers and Central Bank Governors Meeting Communiqué demonstrate that major countries’ financial leaders have realized the necessity and feasibility of developing green finance through various financial instruments, policies, and mechanisms.”

“The Green Finance Study Group has highlighted how important and possible it is for the private sector to work with public bodies in creating the enabling conditions to mobilize green finance,” said Michael Sheren, co-Chair, Green Finance Study Group; Senior Advisor, Bank of England.

Simon Zadek, Co-director of the UNEP Inquiry and lead for UNEP for the GFSG secretariat, added that establishing and co-chairing the G20 GFSG underlines China’s global influence in green finance. “By taking green finance to the G20, China has used its presidency to inspire many countries and financial institutions around the world to take notice of the importance of this agenda,” he said.

China’s pursuit of green finance has been attracting global attention in recent years. Green credit in China now makes up 10 per cent of the balance of total loans and the country is now home to the world’s largest green bond market. China is also one of just three countries that issued “Green Credit Definitions” and was the first country that officially released its “Green Bond Directives” and Green Bond Catalogue.

Elsewhere, countries including Brazil, Indonesia, Kenya, and Sweden are now advancing green finance plans and practices while financial centers – such as Hong Kong, London, Singapore and Switzerland – are entering a “race to the top” by viewing green finance as a source of competitiveness.

About the Inquiry

The Inquiry into the Design of a Sustainable Financial System was established in January 2014 with a mandate to advance policy options that would improve the effectiveness of the financial system in supporting sustainable development. The Inquiry has worked with central banks, environment ministries, international financial institutions as well as major banks, stock exchanges, pension funds and insurance companies.

Source: unep.org

New Global Survey Shows E-government Emerging as a Powerful Tool for Achieving the Sustainable Development Goals

computer-girlThe United Kingdom, followed by  Australia and the Republic of Korea, lead the world in providing government services and information through the Internet, according to a new survey released on 1st August by the United Nations showing the progress of nations in promoting e-government.

The 2016 UN E-Government Survey provides new evidence that e-government has the potential to help support the implementation of the 2030 Agenda and its 17 sustainable development goals (SDGs).  The Survey finds that e-government is an effective tool for facilitating integrated policies and public service by promoting accountable and transparent institutions through open data and e-participation and participatory decision-making as well as by advancing online services to bridge the digital divides.

World and regional e-government leaders

Top E-government performers:

United Kingdom

Australia

Republic of Korea

Singapore

Finland

Sweden

Netherlands

New Zealand

Denmark

France

Regional top E-government performers:

Africa: Mauritius, Tunisia

Americas: United States of America, Canada

Asia: Republic of Korea, Singapore

Europe: united Kingdom, Finland

Oceania: Australia, New Zealand

The rankings are based on the report’s E-Government Development Index (EGDI), which ranks countries by measuring their use of information and communications technologies to deliver public services. The Index captures three dimensions: scope and quality of online services, status of telecommunication infrastructure and existing human capacity.  A key theme is how information and communications technology (ICT) and e-government can best contribute to the implementation of the SDGs. Effective use of ICTs by governments can help people connect to the services they need, as well as to create a fair society that provides equal opportunities for everyone.

E-government has grown at a rapid pace over the past 15 years.  In the 2016 Survey, 29 countries score “very-high,” with EGDI values in the range of 0.75 to 1.00, as compared to only 10 countries in 2003. Since 2014, all 193 Member States of the UN have delivered some form of online presence.  This is in stark contrast to 2003, when 18 countries, or about 10 per cent of all countries, were without any online presence.  In 2016, 51 per cent of countries had “low-EGDI” or “medium EGDI” values, down from over 73 per cent of countries in 2003.

Global and regional trends in e-government development

The Survey indicates that countries in all regions are increasingly utilizing new information and communication technologies to deliver services and engage people in decision-making processes. One of the most important new trends is the advancement of people-driven services – services that reflect people’s needs and are driven by them.

At the same time, disparities remain within and among countries. Lack of access to technology, poverty and inequality prevent people from fully taking advantage of the potential of ICTs and e-government for sustainable development. In 2016, there is still a huge gap between African countries, with a EGDI average of 0.2882, and European countries, with EGDI average of 0.7241. Europe provides 10 times more services to the poor, persons with disabilities and older persons than Africa and Oceania.

To realize the full potential impact of e-government for sustainable development,  the report found that it needs to be accompanied by measures to ensure access and availability of ICT and make public institutions more accountable and more responsive to people’s needs. It concluded that it is essential to ensure that the overarching objective of poverty eradication and “Leaving No One Behind”, a key principle of the 2030 Agenda, are at the core of efforts to mobilize ICT to realize the transformation the 2030 Agenda demands.

The UN E-Government Survey is produced every two years by the UN Department of Economic and Social Affairs. It is the only global report that assesses the e-government development status of the 193 UN Member States. It aims to serve as a tool for countries to learn from each other, identify areas of strength and challenges in e-government and shape their policies and strategies in this area. It is also aimed at facilitating discussions of intergovernmental bodies, including the United Nations General Assembly and the Economic and Social Council, on issues related to e-government and development and to the critical role of ICT in development.

Source: un.org

Centre for Renewable Energy and Energy Efficiency in the Hindu Kush Himalayan Region under Development

indexThe United Nations Industrial Development Organization (UNIDO) and the International Centre for Integrated Mountain Development (ICIMOD), with financial support from the Austrian Development Agency, are preparing to establish a Himalayan Centre for Renewable Energy and Energy Efficiency.

The centre will help address the complex development and energy challenges of the mostly peri-urban and rural areas of the Hindu Kush Himalayan (HKH) region, which is home to more than 200 million people, covering all or parts of Afghanistan, Bangladesh, Bhutan, China, India, Myanmar, Nepal, and Pakistan.

According to Martin Lugmayr, a UNIDO sustainable energy expert, there is a strong demand for decentralized sustainable energy solutions in the HKH region, especially in the off-grid mountain areas, to promote social development and increase the productivity of industrial key sectors, such as food- processing and high-value niche products and services. However, said Lugmayr, a broad range of barriers, including policy and regulatory obstacles, out-dated technology and a lack of capacity and of finance, have prevented the region from taking full advantage of existing and potential renewable energy sources.

“The centre will  scale up ongoing national efforts in the areas of technology demonstration, investment and business promotion, rural energy policy development and implementation, capacity development, and knowledge and data management, as well as awareness-raising. It will also act as a regional hub of Sustainable Energy for All (SE4ALL) excellence in the region,” said Bikash Sharma, an ICIMOD environmental economist.

The centre will be part of the Global Network of Regional Sustainable Energy Centres which is coordinated by UNIDO, in partnership with relevant regional organizations. The network is currently supported by around 90 ministers of energy and heads of governments from sub-Saharan Africa, the Arab region, the Asia/Pacific region, and the Central America and Caribbean region.

Source: unido.org

NASA Satellite Reveals How Much Saharan Dust Feeds Amazon’s Plants

Photo-illustration: Pixabay

What connects Earth’s largest, hottest desert to its largest tropical rain forest? The Sahara Desert is a near-uninterrupted brown band of sand and scrub across the northern third of Africa. The Amazon rain forest is a dense green mass of humid jungle that covers northeast South America. But after strong winds sweep across the Sahara, a tan cloud raises in the air, stretches between the continents, and ties together the desert and the jungle. It’s dust. And lots of it.

For the first time, a NASA satellite has quantified in three dimensions how much dust makes this trans-Atlantic journey. Scientists have not only measured the volume of dust, they have also calculated how much phosphorus – remnant in Saharan sands from part of the desert’s past as a lake bed – gets carried across the ocean from one of the planet’s most desolate places to one of its most fertile.

A new paper published Feb. 24 in Geophysical Research Letters, a journal of the American Geophysical Union, provides the first satellite-based estimate of this phosphorus transport over multiple years, said lead author Hongbin Yu, an atmospheric scientist at the University of Maryland who works at NASA’s Goddard Space Flight Center in Greenbelt, Maryland. A paper published online by Yu and colleagues Jan. 8 in Remote Sensing of the Environment provided the first multi-year satellite estimate of overall dust transport from the Sahara to the Amazon.

Source: enn.com

New Neighborhood in Stockholm To Foster Sustainable Development

Photo: Pixabay


Photo: Pixabay

One might say that the first Global Environmental Conference was not Rio+20 in 1992, but The United Nations Conference on The Human Environment (UNCHE), which took place in 1972 in Stockholm. Although some people may disagree with this affirmation, there is no doubt that the UNCHE, whose main goal was to reduce human impact on the environment, was the first attempt at making society aware of the potential negative consequences of our existing development model on our living and to preserve the environment for coming generations.

Since then, the city of Stockholm has focused on sustainable development alternatives and is still trying to maintain this reputation. Nowadays, according to the City of Stockholm, the Environment Program focuses on six key priorities:
1. Environmentally efficient transportation
2. Goods and buildings free of dangerous substances
3. Sustainable energy use
4. Sustainable use of land and water
5. Waste treatment with minimal environmental impact
6. A healthy indoor environment.

As a consequence of this effort, the city of Stockholm leads the world in sustainable neighborhoods and boasts one of Europe’s largest urban development projects: Stockholm Royal Seaport or “Royal Neighbour”.

Last May, the city of Stockholm disclosed the winners of a design competition for an urban development in the area of Stockholm’s Royal Seaport, formerly a gasworks area of about 236 hectares. ADEPT and the landscape studioMandaworks designed the winning project, and both have been working closely with the city to develop the master plan for an 18-hectare area known as Kolkagem-Ropsten.

There are plans to build more than 12,000 new properties, bringing 35,000 new jobs and a new cultural area to the site. Moreover, the designers have created three new neighborhoods, each with its own unique architectural character brought to life by several architecture studios, including Herzog & de Meuron and Tham & Videgård Arkitekter, making sure the surroundings have a considerable variety of typologies and aesthetics.

In March of this year, the design studio Tham & Videgård Arkitekter unveiled a plan to build four high-rise apartment blocks constructed from solid timber on an old harbor in Stockholm. The architects are planning to use only one material — Swedish pine — throughout the entire building structure.

Source: landarchs.com