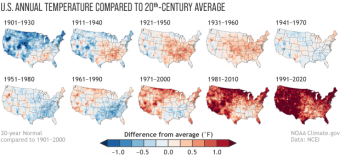
The U.S. Nationaceanic and Atmospheric Administration has updated the U.S. Climate Normals to the 1991-2020 baseline period to provide a most recent baseline for climate information and services to climate-sensitive sectors and a standard reference to compare variations in temperature, precipitation etc to the 30-year average.
The move is in line with a World Meteorological Organization recommendation that the 30-year standard reference periods should be updated every decade in order to better reflect the the changing climate and its influence on our day-to-day weather experience.
Until the end of 2020, the most current and widely used standard reference period for calculating climate normals was the 30-year period 1981-2010. WMO’s recent Services Commission meeting recommended that the new 30-year baseline, 1991-2020, should be adopted globally and pledged support to Members to help them update their figures. Many countries in Europe have already switched to the new baseline.
Rising atmospheric concentrations of greenhouse gases are changing the Earth’s climate much faster than before. As a result, decision-makers in climate-sensitive sectors and industries such as water management, energy, agriculture and viticulture may be basing important decisions on information that may be out of date.
Thus, it is necessary to update the climate normals for operational services for decision-making, for example for as forecasts of peak energy load and recommendations on crop selection and planting times.
However, for the purposes of historical comparison and climate change monitoring, WMO still recommends the continuation of the 1961-1990 period for the computation and tracking global climate anomalies relative to a fixed and common reference period.
More:
For the purpose of Paris Agreement on climate change and its temperature targets, WMO also uses the pre-industrial era as the baseline for tracking global temperature increase in its annual State of the Global Climate report. Thus, the average global temperature in 2020 was about 1.2 °C above the pre-industrial (1850-1900) level.
“The decadal update is the equivalent of the Census for those who use the data,” said NOAA.
Today’s increasingly powerful computers and climate data management systems make it much easier to conduct more frequent updates, which involve analyzing massive amounts of climate data. Another advantage of decadal updates is that they will make it possible to incorporate data from newly established weather stations into the normals more rapidly.

As anticipated, changes have occurred in averages since the last ten-year update, according to NOAA. An upward shift in temperature averages is evident.
“The influence of long-term global warming is obvious: the earliest map in the series has the most widespread and darkest blues, and the most recent map has the most widespread and darkest reds. Today, the normal annual temperatures across the country are warmer than the 20th-century average virtually everywhere. From 1901-1930, the annual average temperature was mostly colder than the 20th-century average,” according to a NOAA news blog explaining the changes.
Warming is not ubiquitous across the contiguous U.S. in either geographic space or time of year. Changes vary from season-to-season and month-to-month.
For instance, the north-central U.S. Temperature Normals—for those in the Northern Plains and Upper Midwest—have cooled from 1981–2010 to 1991–2020, especially in the spring. The South and Southwest are considerably warmer. Normals were also generally warmer across the West and along the East Coast. Precipitation-wise, the Southwest was drier; wetter averages emerged in the U.S. east of the Rocky Mountains, especially the Southeast in the spring.
Source: WMO

